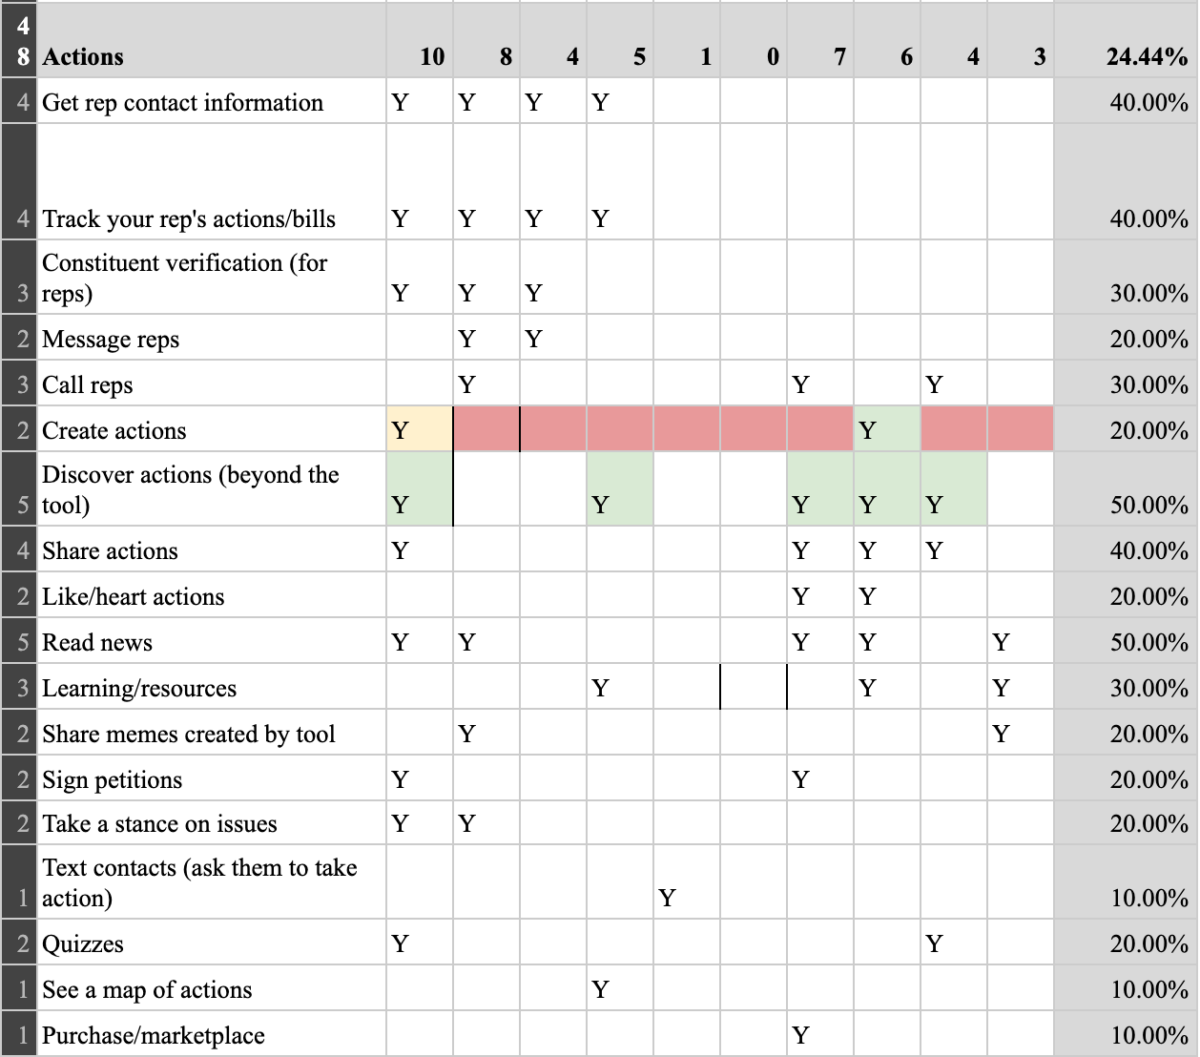
As part of my thesis research, I compared the feature sets of nine tools frequently used by SMOs and ten tools designed to directly support activists in becoming more engaged.
Tools for Organizations
For the first analysis, I selected nine technologies commonly used by social movement organizations based on their approximate frequency of appearance in web searches and industry publications, as well as recommendations from organizers. These nine tools primarily fall into the category of “constituent relationship management” (CRM) technologies. CRMs enable organizations to track and interact with not only customers but also volunteers, donors, legislators, and other supporters.
Reviewing the websites and promotional materials of these nine tools revealed a set of 25 features. The five most common features across all nine tools were 1) event management, 2) reports, 3) contact management, 4) emails, and 5) donations and fundraising management. Other common features used by three or more tools were 1) customization features, 2) groups, 3) campaign management, and 4) forms. The remaining fourteen feature categories were used by only one or two of the tools. Of the nine tools that were reviewed, CiviCRM included the most features (15), followed by The Action Network (11), ActionKit (9) and Mobilize (9). The full results of the analysis can be viewed in the appendix of my thesis.
Tools for Activists
My second analysis focused on the tools used by the existing supporters of SMOs to engage with the issues and organizations they care about. For this analysis, ten technologies designed to support activist activities were selected based on their approximate frequency of appearance in web searches and searching in the iTunes App Store, as well as recommendations from activists. These ten tools are primarily apps, although some, such as Facebook, also include web platforms. DoSomething.org is the only tool that does not also have an app. (It appears there was once a DoSomething.org app but it is no longer supported.)
For each tool, a user journey map was created by capturing screenshots of every key screen in the app. These journey maps were then analyzed to identify 44 features in 5 categories The first category, “Actions,” includes 18 features that enable users to take actions related to the issue they care about. These actions include things like calling reps, taking quizzes, and tracking bills. The 7 “Login and Integration” features identified describe the login and registration experience and the tool’s integration options with social networks such as Facebook and Twitter. The 9 “Community” features identified include chat, internal member directories, and the ability to invite others to the tool. “Personalization” covers 5 features that enable users to filter their experience based on things like personal interests and location. Finally, the 5 “Gamification” features reflect the inclusion of game features like statistics, points, ranks and leaderboards. Of these five categories, Login and Integration features were the most common across all ten apps. In total, the apps had an usage rate of 41% across all the features in this category. The usage rate for other categories were 28% for Community features, 24% for Action features, 22% for Personalization features, and 18% for Gamification features. The full results of the analysis can be viewed in the appendix of my thesis.
